
This Blog shows you how easy it is to Integration OMS with Power BI. OMS solutions are a great way to visualize data and Power BI has built a fantastic set of data visualization tools, so you can unlock some pretty powerful scenarios by using OMS as a data source.
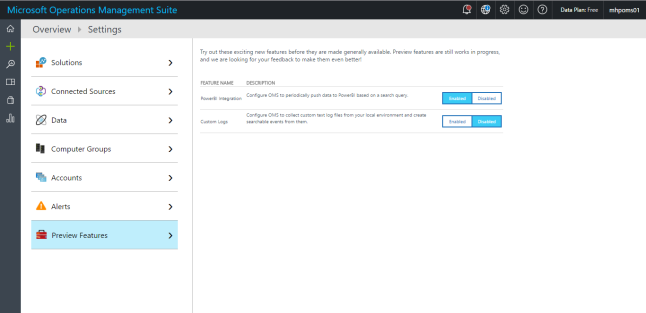
On Portal OMS, Go to Settings > Preview Features, and set the Power BI Integration switch to Enabled
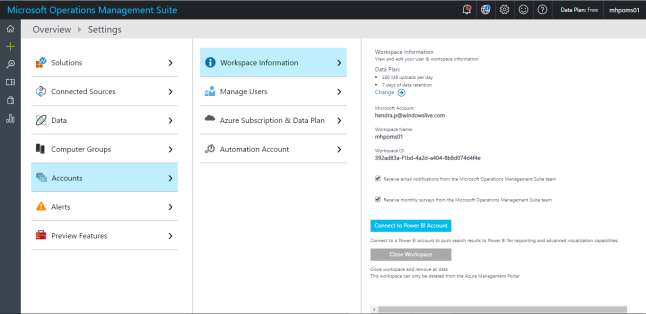
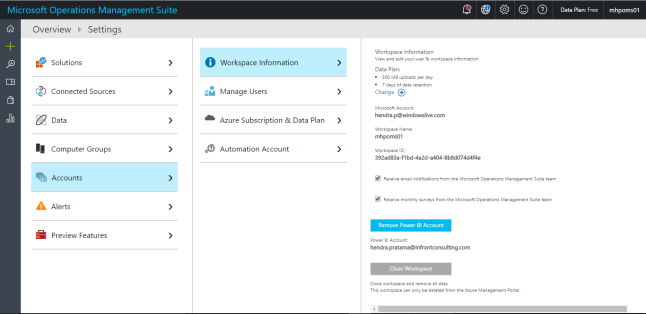
Go to Settings > Accounts > Workspace Information, and select Connect to Power BI Account
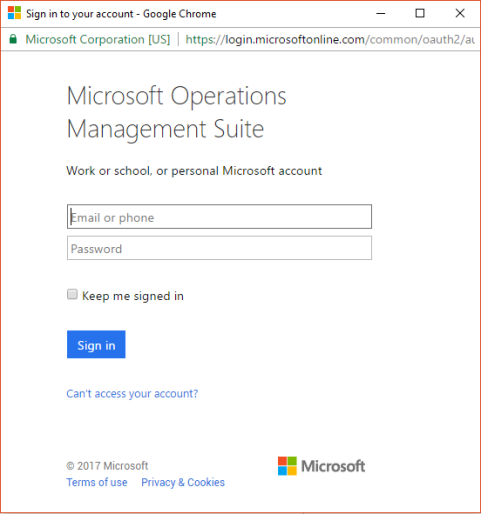
Sign in with your Power BI credentials.
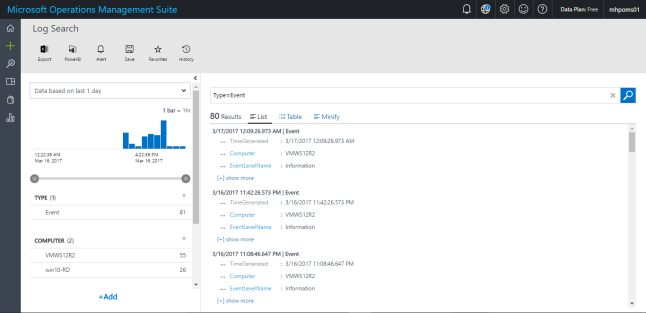
For export our data to Power BI. Go to Log Search from the main page. Type Type=Event and press Enter to search.
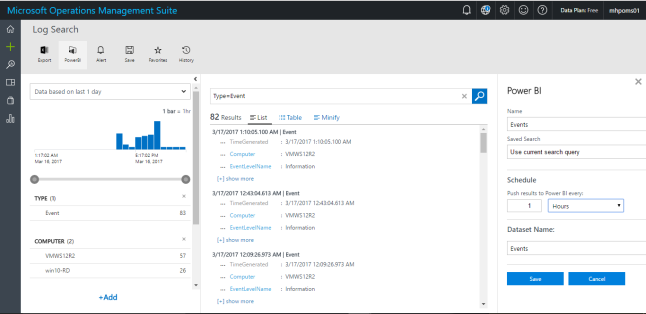
Select PowerBI as seen in the following picture. on Power BI Form use current search quary, give name, and dataset name
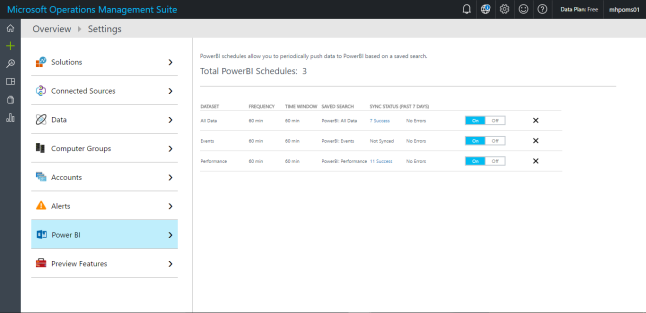
This take up to 10 minutes before the dataset is created in Power BI Go to the Settings and select Power BI.
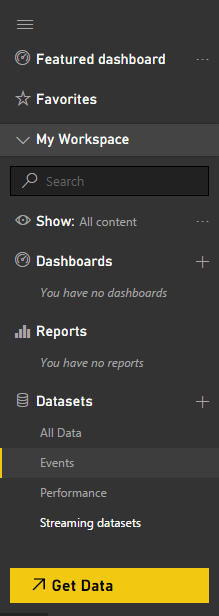
Go to PowerBI.com, and sign in with your Office 365 account. After you´re logged in, select the menu button (![]() ) to bring out this view
) to bring out this view
I want to do is to create a diagram containing information of events log. Select the Pie Chart model, and then check EventLevelName and EventID as seen in the following screenshot.
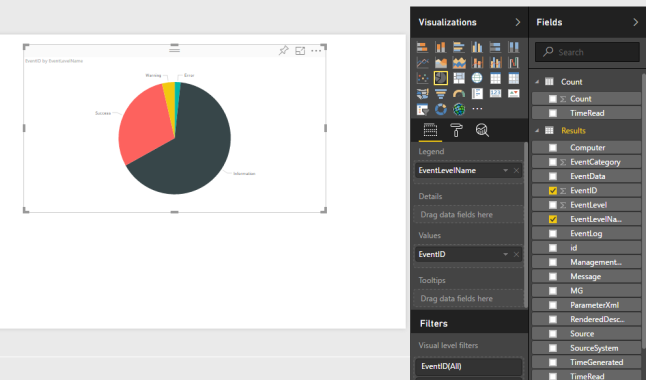
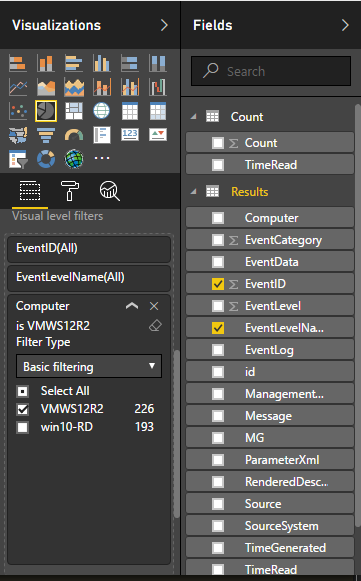
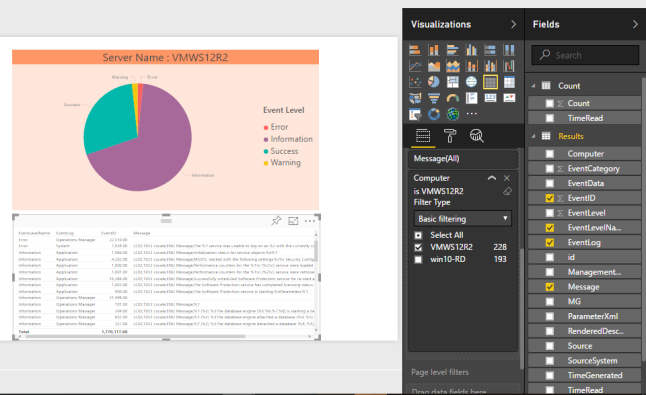
Drag EventID to Values , Drag Computer to visual level filters. In this case, I want to show only one computer in my report.
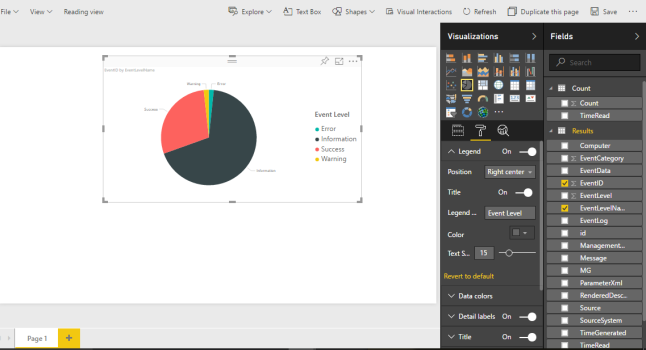
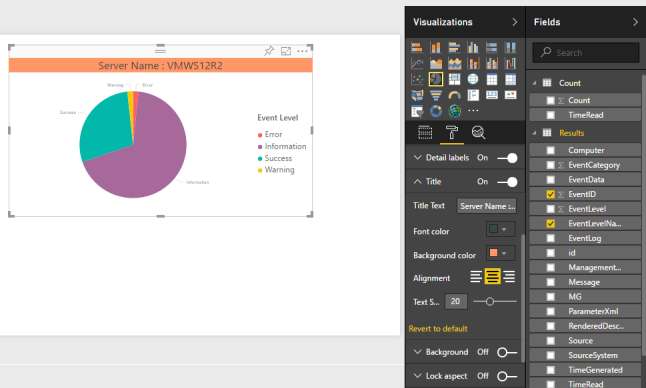
Select the format icon (the pencil) to the right, turn on Legend, choose Right center , and give it an appropriate name.
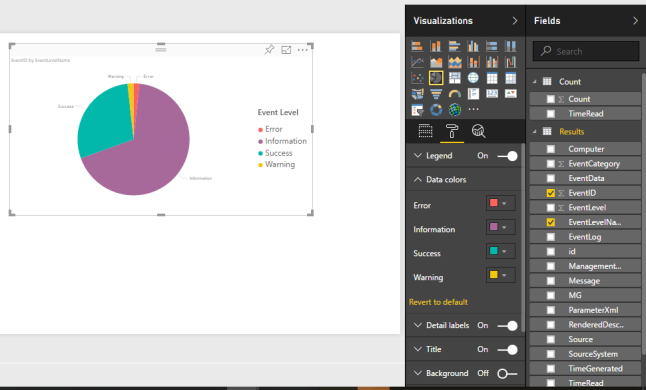
On Data Colors and choose color for each data , and give it an appropriate name.
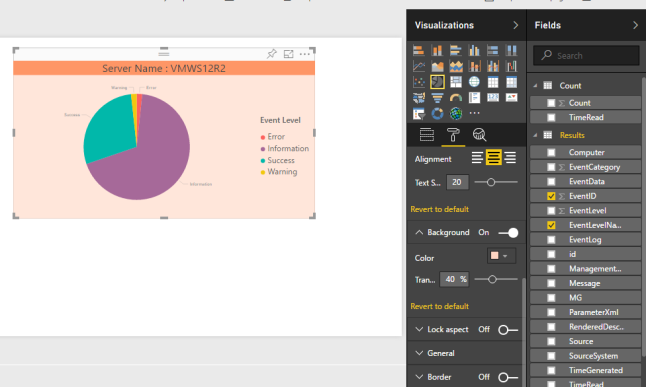
On Title choose color , give it an appropriate name, and set aligment to center.
Turn on Background and set color for background.
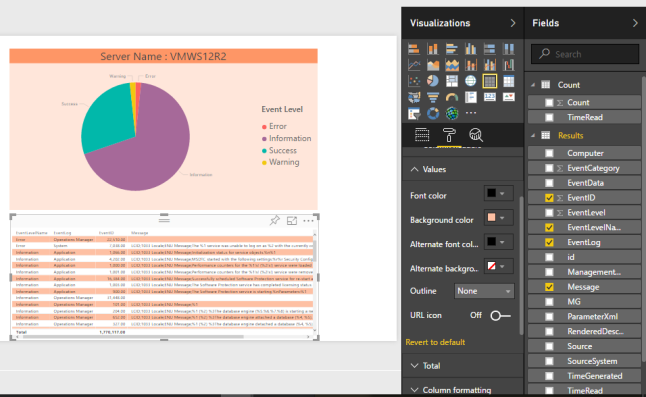
Okay for Pie Chart has Finished, right now i want create a diagram containing information of Event Log Description. Select the Table model Visualizations, and then check EventLevelName , EventLog, EventID ,and Message as seen in the following screenshot.
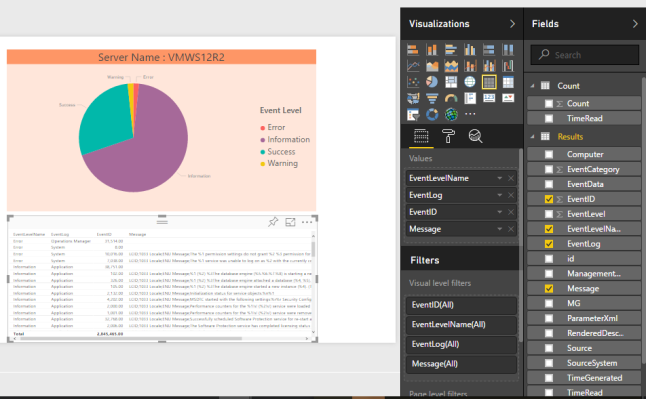
Drag Computer to visual level filters as seen in the following screenshot.
Select the format icon (the pencil) to the right, On Values and set color for font and background.
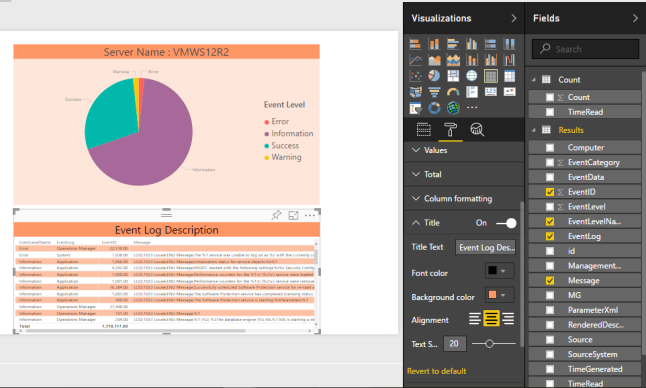
Turn On Title, give it an appropriate name, choose background color and set aligment to center.
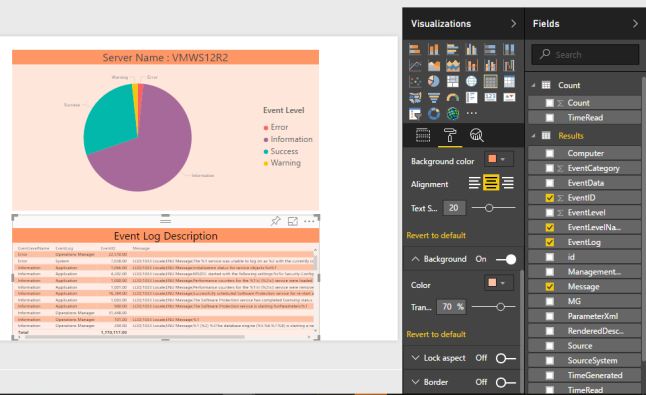
Turn On Background, choose background color and set Transfarency .
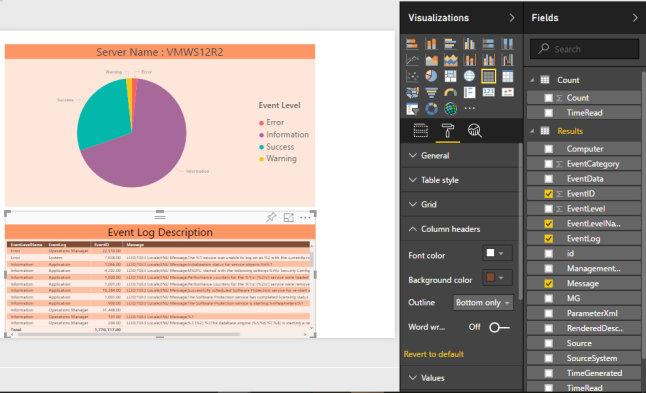
On Column headers, choose background and font color For Column Headers .
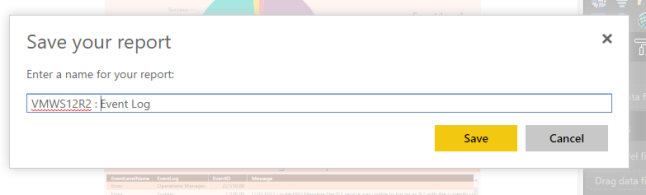
Save and enter a name for report.
You will see result on Report page and click your report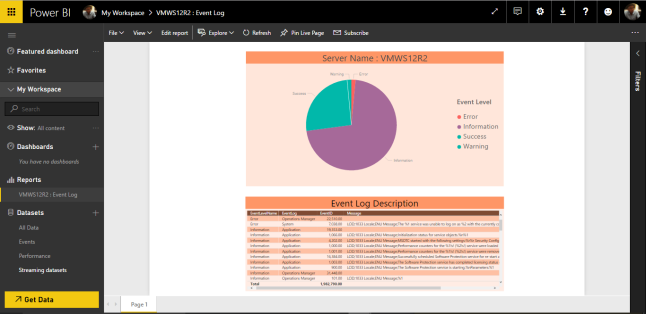
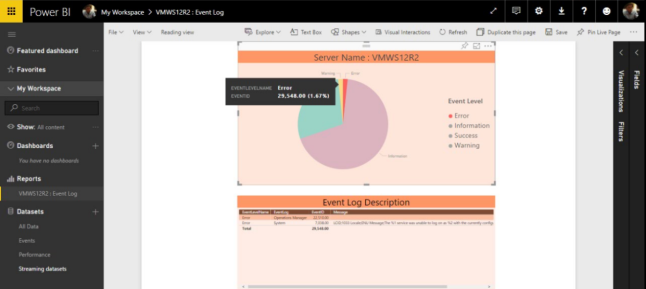
On report if you click Log error on top diagram then on table show description for Event Level Error only
Thank You 
